Posts

Showing posts with the label memory analysis

Virtuoso – Initial Code Release

I've just gotten word that the Virtuoso source code has been approved by the sponsor for public release, so I've uploaded version 1.0 to the Virtuoso Google Code site ! Thanks to Tim Leek at MIT Lincoln Laboratory for seeing this project through the lengthy release review process! Also on Google Code, you can find an installation guide and a walkthrough to get you started. Check it out, and generate some memory analysis tools! If you run into trouble, you can shoot me an email and I'll do my best to help out, but keep in mind that this is a research project, and so there are still lots of rough edges. Enjoy!
Paper and Slides Available for "Virtuoso: Narrowing the Semantic Gap in Virtual Machine Introspection"

I've recently returned from Oakland, CA, where the 2 5 IEEE Symposium on Security and Privacy was held. There were a lot of excellent talks, and it was great to catch up with others in the security community. Now that the conference is over, I'm happy to release the paper and slides of our work, "Virtuoso: Narrowing the Semantic Gap in Virtual Machine Introspection", which I have described in an earlier post . The slides contain some animations, and so I've made them available in three formats: Keynote (iWork 2009) PDF PDF with notes You can also get a copy of the full paper here . I'm also hoping to have the source ready for release soon; when it is available, you'll be able to find it on Google Code under the name Virtuoso . Once again, thanks to my most excellent co-authors at MIT Lincoln Labs and Georgia Tech for helping me see this project through!

Automatically Generating Memory Forensic Tools

Image
Now that the IEEE Symposium on Security and Privacy program has finally been posted , I can describe some research I've been working on for the past year and a half related to virtual machine introspection (VMI) and memory forensics. A well-known problem with VMI and memory forensics is the semantic gap -- basically, the kind of information you want out of a memory image or a running VM is high level information (what processes are running, what files are open, and so on) but what you get is a big bunch of uninterpreted bytes (i.e., a view of physical memory). Bridging this gap is what tools like Volatility were built to do, and they do it well. However, building a tool like Volatility takes a lot of work and a lot of knowledge about the internals of the operating system you're trying to examine. With operating systems like Windows, which are closed source, this kind of knowledge comes from things like the Windows Internals book, blog posts, and good old fashioned reverse en...

Plugin Post: Robust Process Scanner

Image
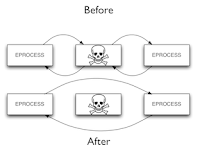
It's pretty well known, in memory forensics circles, that there are two common ways of finding processes in memory images: list-walking , which traverses the kernel's linked list of process data structures, and scanning , which does a sweep over memory, looking for byte patterns that match the data found in a process data structure. Having two different ways of finding processes can be very handy, especially when we suspect that someone may be trying to hide processes. One common way of hiding processes in Windows is called DKOM (Direct Kernel Object Manipulation) ; this technique works by just unlinking the process you want to hide from the kernel's list, like so: This makes it invisible from programs such as the task manager, as well as memory forensic tools that use list-walking (including Volatility's pslist). However, such hidden processes can still be found by scanning memory using a signature for the process data structure; this is what psscan2 does. Unfortunatel...

Odds and Ends

I've been too busy to do any longer entries recently, but I wanted to note a couple things quickly. First up, Andreas Schuster has just released a wonderful set of slides on using Volatility to do memory forensics. The slides include: Great background material on the how, what, and why of memory acquisition and forensics. A refresher on some OS basics you need to really understand memory analysis. An amazing and comprehensive walkthrough on how to use a number of Volatility modules plugins in an investigation (including a few of my own tools, like ssdt.py and VolReg ). Great information on the internals of Volatility, including a tutorial on creating your own plugins. This is really awesome stuff, and I highly recommend it to anyone looking to learn more about Volatility or even start contributing to the community with new plugins! Many thanks to Andreas! Second, I wanted to let everyone know once again that I'm going to be speaking at the SANS WhatWorks Summit in Forensics a...

Using Volatility for Introspection

This post could also be titled " Teaser ", part 2 :) As part of my research at GT, I've been looking at using Volatility to examine the state of running virtual machines. Using PyXa, a wrapper around Bryan Payne's XenAccess library (available in the tools directory of the latest XenAccess release), you can get access to the memory of Xen guest VMs in Python. From there, it's just a small step to create a new address space that Volatility can use to examine virtual machines just as if they were any other memory image. One application of this is using introspection to find out the state of windows on screen. This has advanced significantly since the last time I mentioned it, and it's now possible to track windows, including their z-order and some on-screen text, in near-real time. To demo this I used Volatility to examine the internal data structures of Win32k.sys and extract the locations and sizes of all visible windows, and then used PyGame to draw them ...

Updates and a New Home for Plugins

As I've now released a number of plugins for Volatility, and some have gone through a couple revisions, I thought I'd put them all up on a single page , which can point to the latest versions and act as a sort of one-stop shop. I've also updated the registry tools yet again, to fix some bugs and add new functionality, and also made some enhancements to volshell. You can read about the changes below: Changes to VolReg : New command hivedump : dump keys and timestamps (and optionally value data) from all hives to a CSV file. Many improvements to robustness and error handling when reading key and value data. When checking the registry hive names, catch exceptions and try to continue anyway (reported by chris). Changes to volshell : A new command, dis , is available. If distorm is installed, it will disassemble bytes from a given memory address as x86 code. db no longer rounds length to a multiple of 4. Use a single profile object throughout all commands (speed improvement) dt...

RegRipper and Volatility Prototype

When I first released the registry tools for Volatility , I discussed the possibility of interoperating with Harlan Carvey's excellent RegRipper . Now, thanks to Inline::Python and a bit of hackery, you can now run RegRipper against a memory image! Unfortunately, since Inline::Python only seems to work on Linux, you'll need to have a working Linux box around to use this (if anyone knows of a cross-platform way to use Python code from Perl, please let me know!). I'll get to the details of how this works later, but for now let's talk about how you actually use this stuff. First of all, since we depend on Inline::Python to manage the unholy union of Perl and Python, you'll need to get it from CPAN or your distribution's package manager. No need to install Parse::Win32Registry ; I've replaced it with my own registry code that will run against memory. Next, you should download the latest version of the registry tools [ tarball , zip ] (side note: I updated the...

Teaser

Image
I don't have time for a full post right now, but I thought I'd offer a fun product of some things I've been working on recently. The work involves getting information about the windows on screen at the time a memory image was taken. One of the things you can extract is the position and size of each widget (called a "window", though I find this terminology a little confusing). Since I don't have time to go into the data structures and so on involved, I thought I'd give you all two "screenshots" that I reconstructed from the NIST XP SP2 memory images. Basically it's a white canvas as large as the screen resolution, with rectangles drawn on for each window on the screen. Without further ado: From the 6/25 image: From the 7/4 image: More details to come :)

Registry Code Updates

I've found a couple bugs in the registry code I released recently, and at least one is significant enough that a new release is warranted. Teach me to release code I wrote in a couple hours on a plane ;) The list of fixes is: Fix a bug that prevented any volatile subkeys from appearing when using the subkeys() function. Add a check for None when using lsadump (reported by Paul Bobby, thanks!) Add appropriate license statements at the top of each file (thanks AAron!). For the record, the license is the GNU General Public License (GPL). You can download the new version as a zip or tarball , and install it exactly as the previous version, by extracting it into your Volatility directory. If you have a previous version installed, this should just overwrite it (though you may have to tell your unzip program that's okay). As before, PyCrypto is required for the credential extraction modules. One final note: I have seen some crashes when people attempt to use the hash extraction code...

Memory Registry Tools!

Hi everyone! I know it's a bit late, but I made you all a Christmas present: tools for accessing registry data in Windows memory dumps. This the work that I presented at DFRWS 2008 ; it took a while to release because I had to find time to port it to Volatility 1.3. To use them, grab either the zip or the tarball and extract it to your Volatility directory. You'll get the following new plugins (along with some supporting files): hivescan : finds the physical address of CMHIVE structures, which represent a registry hives in memory hivelist : takes a physical address of one CMHIVE, returns the virtual address of all hives, and their names printkey : takes a virtual address of a hive and a key name (e.g., 'ControlSet001\Control'), and display the key's timestamp, values and subkeys hashdump : dump the LanMan and NT hashes from the registry (deobfuscated). See this post for more details on how this is accomplished. lsadump : dump the LSA secrets (decrypted) from the ...

Plugin Post: Moddump

By now, you all probably know that you can dump running programs from memory using the procdump module in Volatility. But not all malware runs as a user-mode process. What about malicious kernel modules? As it turns out, dumping these is also quite straightforward, and it's easy to write a plugin to do it. In fact, it's downright trivial -- kernel modules are just PE files mapped into kernel memory (in exactly the same way as normal programs are PE files mapped into user memory). So to dump a particular kernel module, we can use Volatility's built-in PE dumper (the source is in forensics/win32/executable.py , and point it at the memory address of a kernel module. Naturally, I've made a plugin that implements this: grab moddump.py and put it in your memory_plugins directory, and you'll be good to go. Here's what it looks like in action: $ python volatility moddump --help Usage: moddump [options] (see --help) Options: -h, --help show this help mes...

Window Messages as a Forensic Resource

In which window messages are explored, a new plugin is created, and we learn the importance of reading messages sent to you regularly. In Windows, the GUI system is event-driven –actions occur in response to various events generated by the system. When you press a key on the keyboard, Windows generates a window message (specifically, WM_KEYDOWN ) and sends it to the thread that owns the window that's in focus. That thread then call's the window's event handling procedure (the so-called WindowProc ) to process the message. There are many such messages , covering input events such as keyboard and mouse actions, system-level events such as notification of a time change or a change in the system's power state , and events related to the windowing system, such as resizing or moving a window. How can these be forensically relevant? Well, as it turns out, some threads in buggy applications aren't always good at processing their messages, and messages they receive pi...

Auditing the System Call Table

When malicious, kernel-level code is installed on the system, one action it may take is to hook various system services. What this means is that it takes some standard piece of operating system functionality and replaces it with its own code, allowing it to alter the way all other programs use the OS. For example, it may hook functions involved in opening registry keys, and modify their output so as to hide registry keys the rootkit uses. As system calls are the primary interface between user and kernel mode, the system call table is a popular place to do such hooking. It's worth noting that many security products also make heavy use of hooking. One common example is antivirus software; among the many functions it hooks is NtCreateProcess (used, as the name suggests, to start a new process) so that it can do its on-demand scanning of any newly launched programs. For this reason, it's not safe to assume that any hooking of system calls is malicious; in fact, some of the most su...

Linking Processes to Users

In the course of an investigation, it may be critical to be able to link up a process that's running to a particular user account. Particularly in a multi-user environment such as Windows Terminal Server, this isn't always as easy as checking who was logged in at the time. Luckily, each process in Windows has an associated token , a chunk of metadata that describes what Security Identifier (SID) owns the process and what privileges have been granted to it. As Larry Osterman explains , A SID is essentially a unique ID that is assigned to a user or group, and is broken into several parts: the revision (currently always set to 1), the identifier authority (describing what authority created the SID, and hence how to interpret the subauthoriries), and finally a list of subauthorities . In general, when users see SIDs (which they rarely do), they are in what's called the Security Descriptor Definition Language (SDDL) form. This is a string that looks like: S-1-5-21-1957994488...

Parsing Windows Minidumps

When a user-mode application crashes in Windows, a built-in debugger known as " Dr. Watson " steps in and captures some basic information that can be sent back to developers to help debug the crash. As part of this process, it creates what's called a minidump that contains portions of the process's memory and a great deal of extra information about the state and attributes of the process. Among the information available is: CPU state for each thread. A list of loaded modules, including their timestamps. The Process Environment Block (PEB) for the process. Basic system information, such as the build number and service pack level of the perating system. The process creation time, and how long it has spent executing in kernel and user space. Detailed information on the exception that was raised. Using the userdump.exe utility provided by Microsoft, it is also possible to take a complete snapshot of the memory of any running process. This tool also, as i...

DFRWS 2008 - Registry Forensics in Memory

I'm pleased ecstatic to announce that my paper, Forensic Analysis of the Windows Registry in Memory , has been accepted into the 8th annual Digital Forensics Research Workshop ! The full program is available, and it looks like there are a lot of really cool presentations scheduled. Memory analysis is heavily featured this year, and has been given a whole session. As usual, all the papers will be posted on the DFRWS website once the conference begins. Until then, here's the abstract of my paper: This paper describes the structure of the Windows registry as it is stored in physical memory. We present tools and techniques that can be used to extract this data directly from memory dumps. We also provide guidelines to aid investigators and experimentally demonstrate the value of our techniques. Finally, we describe a compelling attack that modifies the cached version of the registry without altering the on-disk version. While this attack would be undetectable with conventional on...

Finding Kernel Global Variables in Windows

When performing memory analysis of Windows systems, there are a number of kernel variables that are extremely helpful in determining the state of the operating system. For example, the global variable PsActiveProcessHead is a pointer to the start of the kernel's list of _EPROCESS structures, and PsLoadedModuleList points to the list of currently loaded kernel modules (i.e., drivers). Unfortunately, these variables are not among those exported by the kernel, so finding them isn't as simple as looking them up in the export table of ntoskrnl.exe . How, then, do tools like Volatility find these addresses so that they can produce process listings from memory dumps? The simplest technique is just to hard-code the address of each variable. The "basic" version of Volatools does exactly this; if you open up vsyms.py , you will see the hardcoded values for PsLoadedModuleList , PsActiveProcessHead , PsIdleProcess , and HandleTableListHead . The downside of this is that the ...

Cell Index Translation

Throughout our previous discussions of registry keys, hives, and so on, we have run into the concept of a cell index several times. They appear in kernel memory in places such as the KeyCell member of the _CM_KEY_CONTROL_BLOCK structure; likewise, all of the structures representing portions of the hive itself ( _CM_KEY_NODE , _CM_KEY_VALUE , and so on) have members that point to other structures by cell index rather than by virtual address. The reason for this is that registry hives live two lives: one, as on-disk files, stored in %WINDIR%\system32\config\ , and another, as an in-memory structure that the Configuration Manager uses in memory. In the former, cell indices can be thought of essentially as simple offsets from the start of the file; in the latter, however, the situation is more complicated. When registry hives are represented in memory, they must account for the fact that new keys and values may be added at any time. Since space for the hives is allocated out of paged po...

Keys Open by Hive

Quick addendum: I thought it might also be fun to post how many keys were open in each hive (this is for xp-laptop-2005-07-04-1430.img -- and sorry for the huge amount of space, Blogger's auto-formatting seems to get confused around tables): Hive Key Count [...]a\Microsoft\Windows\UsrClass.dat 1 [...]Settings\LocalService\NTUSER.DAT 7 [...]WINDOWS\system32\config\SECURITY 11 [...]1\WINDOWS\system32\config\system 1122 [...]a\Microsoft\Windows\UsrClass.dat 1 [...]ts and Settings\Sarah\NTUSER.DAT 147 [...]a\Microsoft\Windows\UsrClass.dat 1 [...]\WINDOWS\system32\config\default 25 [...]ttings\NetworkService\NTUSER.DAT 4 [...]ume1\WINDOWS\system32\config\SAM 14 [NONAME] 4 [NONAME] 4 [...]WINDOWS\system32\config\software 2657